Colorado State University forest science researchers and partners are dabbling in the graphic arts to help land managers overcome the challenge of helping their stakeholders see the forest for the trees.
A research team led by faculty in the Forest and Rangeland Stewardship department in collaboration with U.S. Forest Service (USFS) Rocky Mountain Research Station researchers and managers adapted a visualization program typically used to envision fire dynamics to create three-dimensional pictures of different forest management outcomes.
The USFS is distributing these visual possibilities through a new General Technical Report, GTR-365, to staff throughout the Rocky Mountain Region. The resulting visual graphics will help researchers and land managers facilitate discussions for forest management objectives and prescriptions in the field. This initial report shows a model that can be expanded to other forest systems across the west.
The visualizations provide idealized projections, so incorporating historical data and existing conditions can be part of the conversation contractors, stakeholders and policy makers have with managers to create holistic and realistic approaches to forest restoration.
“When it comes to restoring ecological processes in forest ecosystem, the spatial arrangement of the trees plays a very important role,” Assistant Professor Wade Tinkham said. “However, managers have faced mounting issues with trying to communicate with stakeholders and contractors what different spatial arrangements look like.”
Land managers expressed their need to better communicate three-dimensional data about forest treatments. Associate Professor Chad Hoffman has used the visualization program “Smokeview,” developed by the National Institute of Standards and Technology, to visualize fire simulation results for wildfire scenarios. This research group saw an opportunity to utilize the program’s capabilities to address this challenge.
“This program isn’t widely used to represent three-dimensional forest structure in this way,” Hoffman said. “We had to link tools from different disciplines and fields of study to develop the range of visualizations we needed.”
Hoffman provided the model and the team used their collective expertise in forestry biometrics and silviculture to map and simulate treatments of forest stands. The illustrated renderings found in GTR-365 are the result of incorporating intensive forest inventories from four different Colorado ponderosa pine and dry-mixed conifer forests in need of restoration.
“Ultimately, forest restoration is all about restoring ecological function to ecosystems,” Assistant Professor Seth Ex said. “Heterogeneous spatial structures like those visualized in the report may have some qualities that support the reestablishment of natural disturbance regimes.”
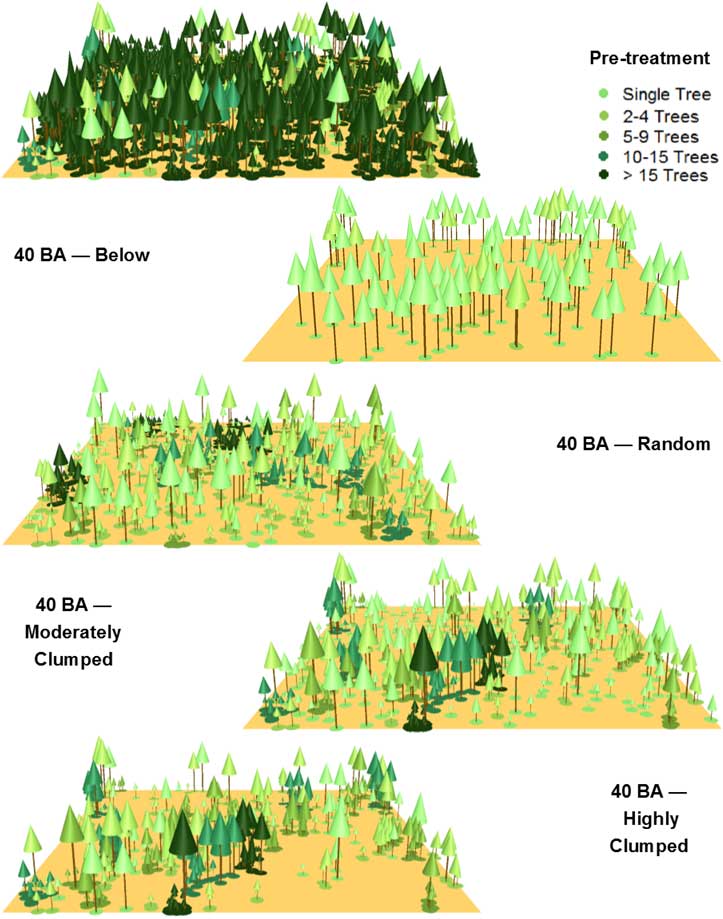
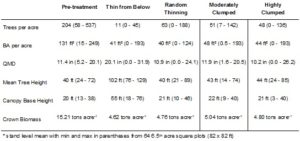
Each illustration clearly shows different distributions of individual trees, tree clumps and openings that could result from different forest treatments like thinning from below or variable retention harvesting. Connecting traditional inventories with the resulting patterns shows the link between forest treatments and the historical mosaics that once existed across the landscape.
Tinkham explained an easy way to picture these historic conditions is to compare a forest to a city with distinct neighborhoods. Individual houses are part of one neighborhood and not another based on geographic (place-oriented) and social (people-oriented) connections. Likewise, this visualization program places individual trees into a neighborhood, or clump of trees, based on geographic and social ties the trees may have with each other. The types of forest treatments will have different impacts on these relationships by altering tree spacing, which will influence fire behavior, wildlife habitat and plant resource competition.
“If people understand what these patterns look like, then we can start talking about what these patterns mean for all the other ecological processes we’re managing for,” said Tinkham.
There has not been an easy way to show connections between forest management and desired objectives before, but now a picture can be worth a thousand data points.
This research team also included USFS Research Forester Mike Battaglia, and Michigan Tech University Assistant Professor Yvette Dickinson (previously at CSU). This research and publication was supported by the U.S. Forest Service and Colorado State University. The Department of Forest and Rangeland Stewardship is a part of Warner College of Natural Resources.