Wildfires regularly encroach on the growing wildland-urban interface, where homes exist in and adjacent to the forest. In the past, it has been unclear to fire managers how reliable current mapping methods are at identifying buildings at risk of igniting during fires. Until now.
Researchers from Colorado State University and the U.S. Geological Survey have quantified how well wildland-urban interface mapping methods can capture patterns of building loss in wildfires.
The study, “Building Loss in WUI Disasters: Evaluating the Core Components of the Wildland–Urban Interface Definition,” recently published in the journal Fire analyzed the most destructive fires of the 21st century.
The research team was led by Michael Caggiano, research associate with the Colorado Forest Restoration Institute. They found that wildland-urban interface maps created from the footprints of buildings classified 97 percent of the homes that were lost in fires. This compares with 86 percent accuracy using conventional census tract methods. The analysis also found that all losses occurred within a half-mile of wildland vegetation.
“In essence, we have a road map for determining which homes and communities are at risk,” Caggiano said. “Refining estimates of the number of homes in danger of igniting during a wildfire can help prioritize where money is spent to more effectively protect the wildland-urban interface.”
Recent wildfires no longer only affect forests, but have consumed entire towns or even spread into urban areas considered low-risk. The fall 2020 East Troublesome and Cameron Peak fires in Colorado burned hundreds of homes in wildland-urban interface areas.
Caggiano said the point based wildland-urban interface mapping framework can improve wildfire planning and preparedness at state, county and local levels.
Is your home at risk?
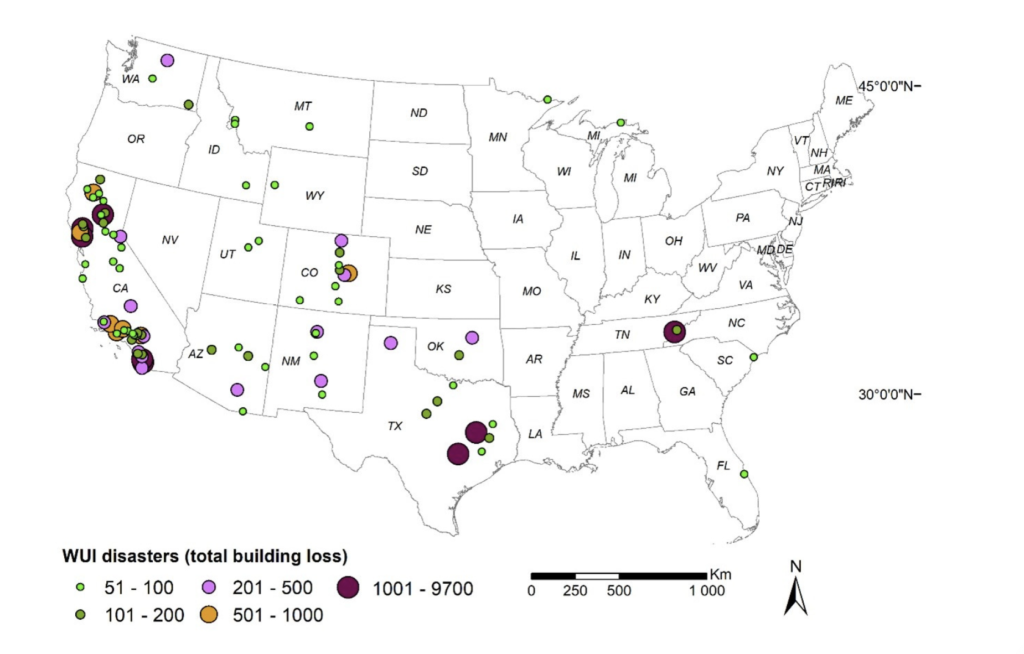
For their analysis, Caggiano’s team used spatial and non-spatial datasets to identify destructive wildfires between 2000 to 2018. Out of the tens of thousands of wildfires recorded during this time period, they found there were only 100 wildfires that burned more than 50 buildings each.
“The 100 most destructive wildfires were responsible for over 80 percent of all wildfire-caused home loss,” Caggiano said.
His team’s study evaluated SILVIS wildland-urban interface maps for these fires, which were concentrated in California, Colorado, Arizona, New Mexico, and Texas. The SILVIS maps, created by scientists at the University of Wisconsin-Madison, are based on U.S. Census Bureau land cover data and are the most widely-used maps of their kind in the U.S.
Alternatively, point-based maps use fine-scale building footprints identified from high-resolution satellite imagery which has recently become more widely available. In effect, the SILVIS wildland-urban interface maps provide a 30,000-foot view, while point-based maps show what can be seen at street-level.
While the SILVIS maps captured 86 percent of the building loss from these fires, Caggiano said they also included some buildings that weren’t at high risk. In contrast, the point-based maps enabled higher specificity and sensitivity and can be used to better identify individual at-risk buildings, and exclude buildings at low risk.
“The point-scale data represents all the buildings in that area, so we are quite certain those that are included in these maps were and are indeed at risk,” Caggiano said.
New wildland-urban interface buffer distance
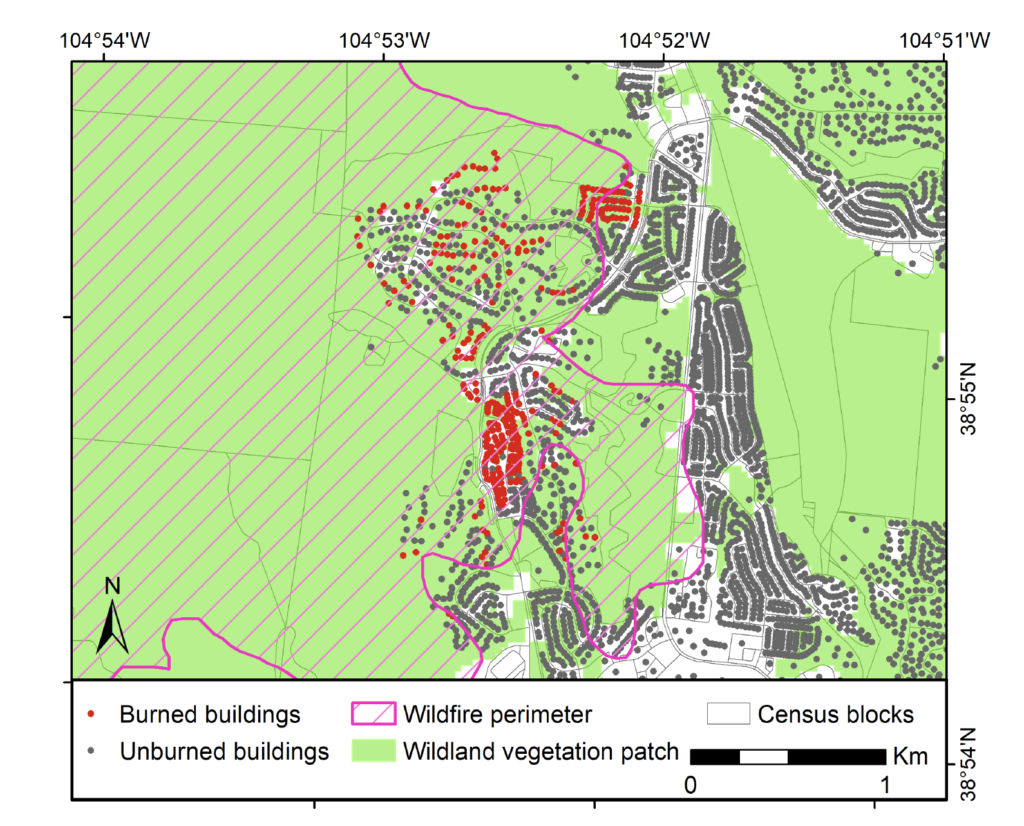
Previous mapping efforts have identified the wildland-urban interface as areas where homes were within 1.5 miles of wildland vegetation. In this study, Caggiano’s team found that distance to be overly conservative, since 95 percent of building losses happened within 100 meters of large patches of wildland vegetation, and the remaining losses occurred within a half-mile.
Caggiano said bringing in this new conservative half-mile threshold may be appropriate for point-based wildland-urban interface maps. Doing so could help land managers focus their attention on buildings with the highest risk of ignition and result in more accurate risk assessments and efficient use of risk mitigation resources.
“The majority of loss occurred where buildings were surrounded by wildland vegetation, but we also observed building loss in more urban environments immediately adjacent to wildland vegetation, where structures likely ignited either from embers produced from nearby buring vegetation or from other buildings,” Caggiano said.
Caggiano said these mega fires creating wildland-urban interface disasters are increasingly common and that these events result in greater building losses. As Western states live within this new normal of record-breaking wildfire size and damage, more detailed maps can help communities strategize how to better protect homes.
“As we manage these forests, it’s important to understand where home loss will occur and how communities can minimize risk,” said Caggiano.